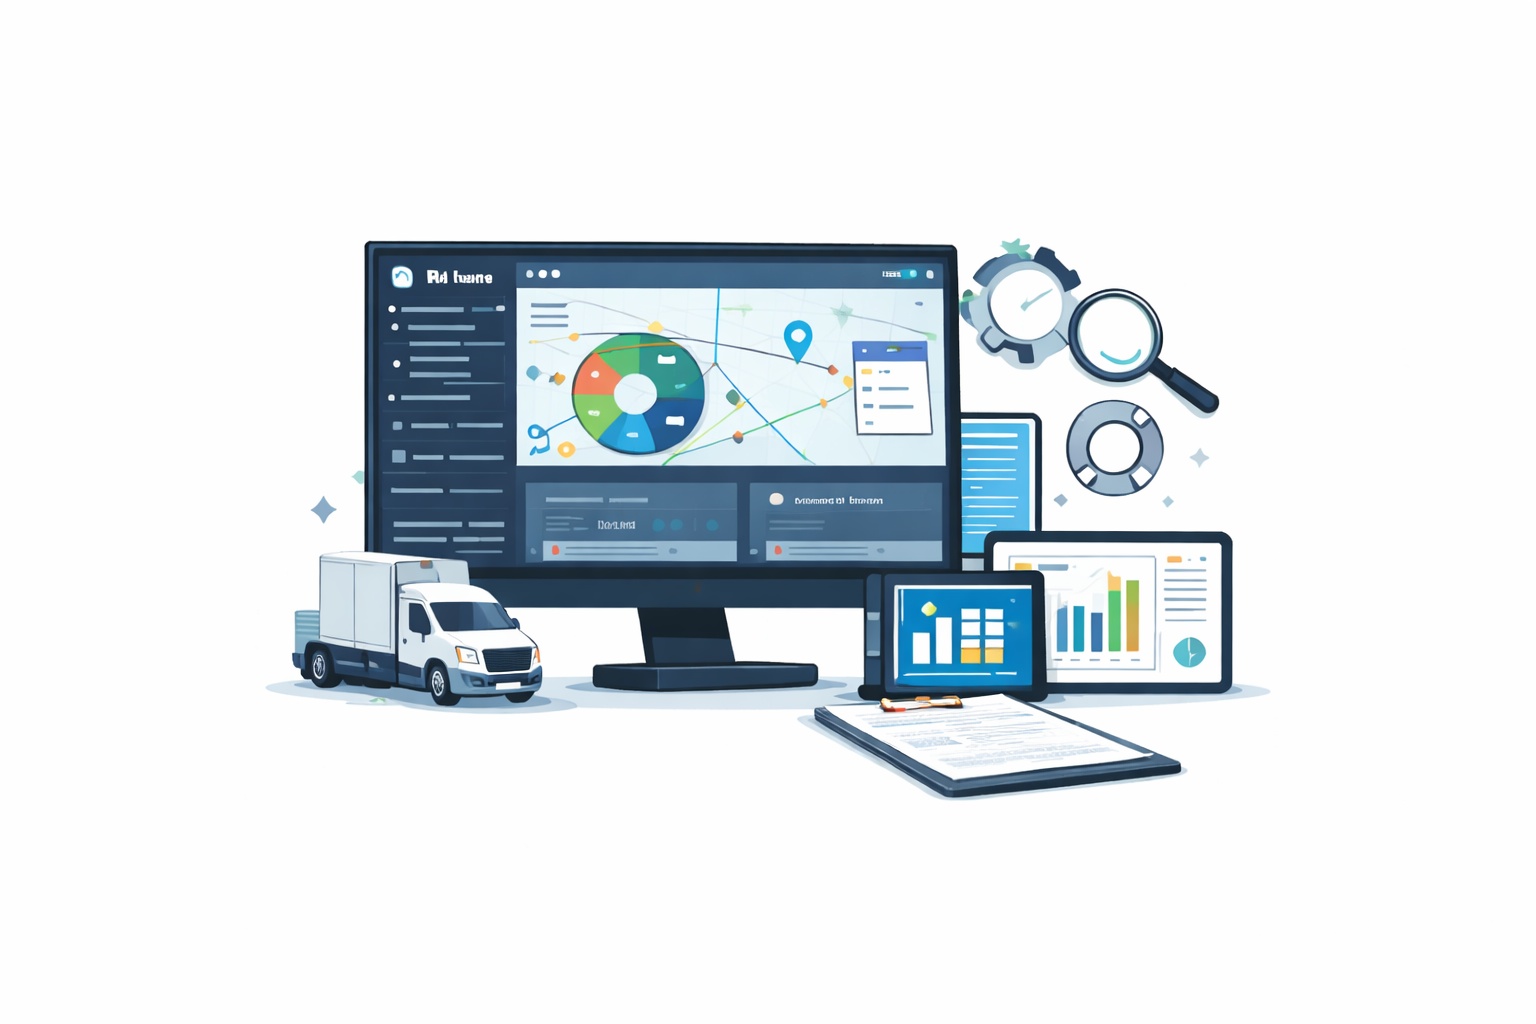
Fleet Reporting & Analytics Software for Data-Driven Fleet Operations
Fleet reporting and analytics software centralizes operational data into structured dashboards and standardized reports that support maintenance, compliance, cost control, and utilization decisions. For fleet managers and operations leaders, it provides visibility into performance trends, KPI integrity, and operational risk exposure across vehicles, equipment, drivers, and locations.

KPI Definition Control Sheet
| KPI Name | Calculation Rule | Data Source | Common Failure Mode |
|---|---|---|---|
| Preventive Maintenance Compliance | PMs Completed ÷ PMs Scheduled | Work Order Records | Inconsistent PM scheduling intervals |
| Fleet Downtime Rate | Downtime Hours ÷ Available Hours | Maintenance Logs | Missing out-of-service timestamps |
| Maintenance Cost per Mile | Total Maintenance Cost ÷ Miles Driven | Cost + Mileage Data | Fuel or labor exclusions |
| Utilization Rate | Active Use Hours ÷ Total Available Hours | Telematics or Trip Logs | Inaccurate vehicle status tracking |
| Work Order Cycle Time | Open to Close Duration | Work Order System | Delayed close-out entries |
Real-Time Monitoring Metrics vs Period-End Performance Metrics

Real-Time Monitoring Metrics
- Active vehicle status and location
- Open work orders by priority
- Vehicles overdue for preventive maintenance
- Live fuel consumption trends

Period-End Performance Metrics
- Monthly maintenance cost per asset
- Preventive maintenance compliance rate
- Downtime percentage by vehicle class
- Cost variance vs annual fleet budget
Real-time metrics support dispatch and daily shop management, while period-end metrics guide budgeting, policy adjustments, and executive reporting.
What Fleet Reporting & Analytics Software Does Operationally
Fleet reporting software consolidates maintenance, fuel, telematics, inspection, and cost data into structured dashboards that support operational decisions.
- Centralizes work order, service history, fuel, and inspection records
- Standardizes KPI calculations across locations
- Visualizes trends in downtime, cost, and utilization
- Supports audit-ready documentation and compliance reviews
- Enables filtering by asset class, location, or department
Operational Outcome:
- Faster issue identification
- Reduced manual spreadsheet consolidation
- Clear ownership of performance metrics
For KPI design methodology and formula alignment, fleets often reference structured frameworks such as the fleet maintenance KPIs with formulas guide.
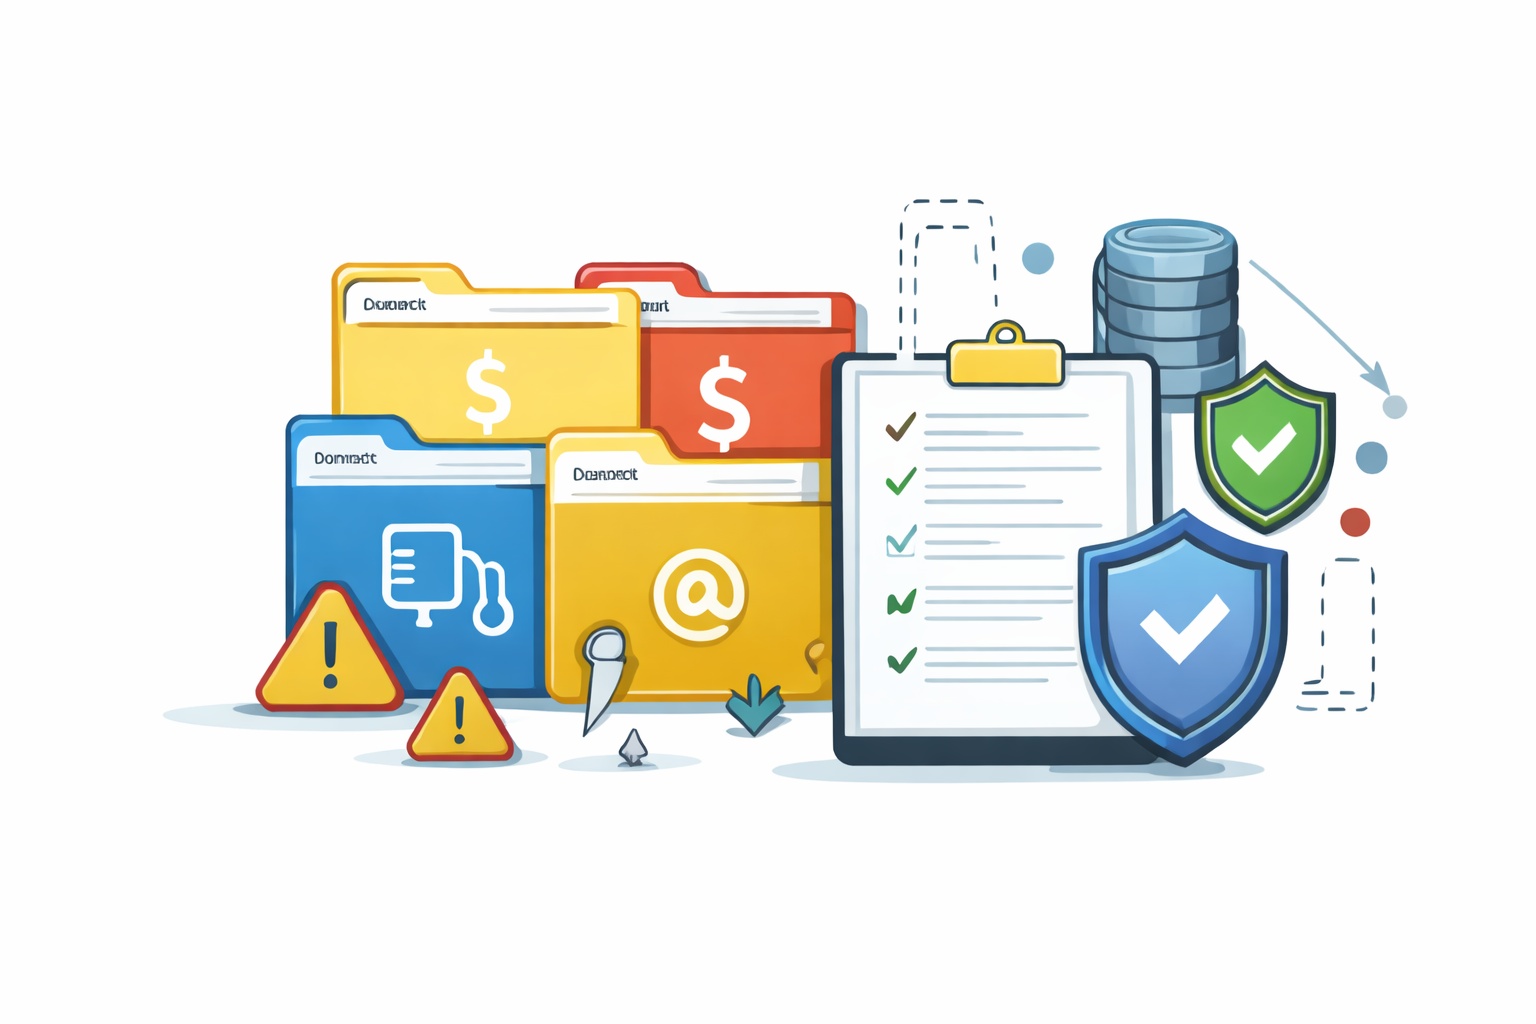
Data Inputs, Definitions, and Governance Controls
Analytics reliability depends on consistent data entry, aligned definitions, and structured governance controls.
- Standardize preventive maintenance intervals across asset classes
- Require structured work order close-out procedures
- Align cost categories (labor, parts, vendor services)
- Define downtime start and end rules
- Establish monthly data validation reviews
Without governance, dashboards reflect inconsistent interpretations rather than operational reality.
Fleets implementing reporting controls alongside broader management practices often align them with principles outlined in the fleet manager guide to ensure role clarity and accountability.
Governance Outcome:
- Reduced metric disputes
- Consistent cross-location reporting
- Stronger audit defensibility
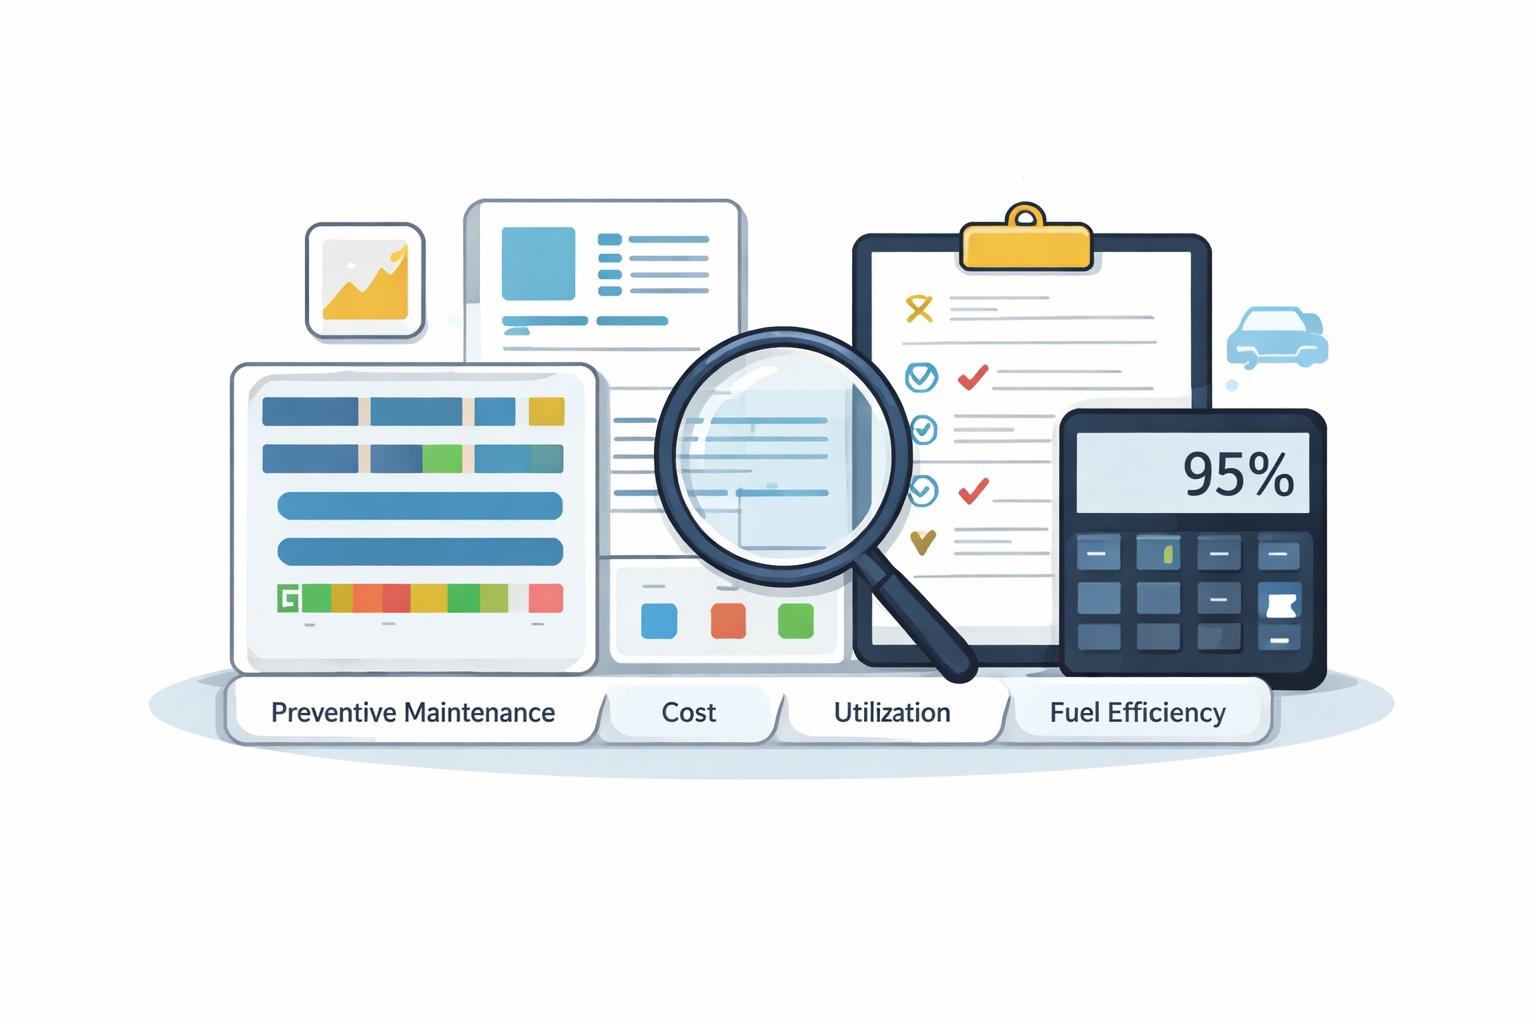
Core Report Types and KPI Design for Fleet Decisions
Fleet reporting software typically supports multiple operational report categories.
- Maintenance performance reports (PM compliance, backlog trends)
- Cost control reports (cost per mile, cost per asset class)
- Utilization and idle time analysis
- Fuel efficiency and consumption reports
- Compliance and inspection completion tracking
Effective KPI design requires:
- Clear formulas with documented calculation rules
- Defined metric owners
- Fixed refresh cadence (daily, weekly, monthly)
- Role-based dashboard access
Supporting documentation such as a preventive maintenance schedule template helps align reporting outputs with planned service intervals and structured maintenance planning.
Decision Support Outcome:
- Improved maintenance forecasting
- Better capital planning visibility
- Stronger performance benchmarking

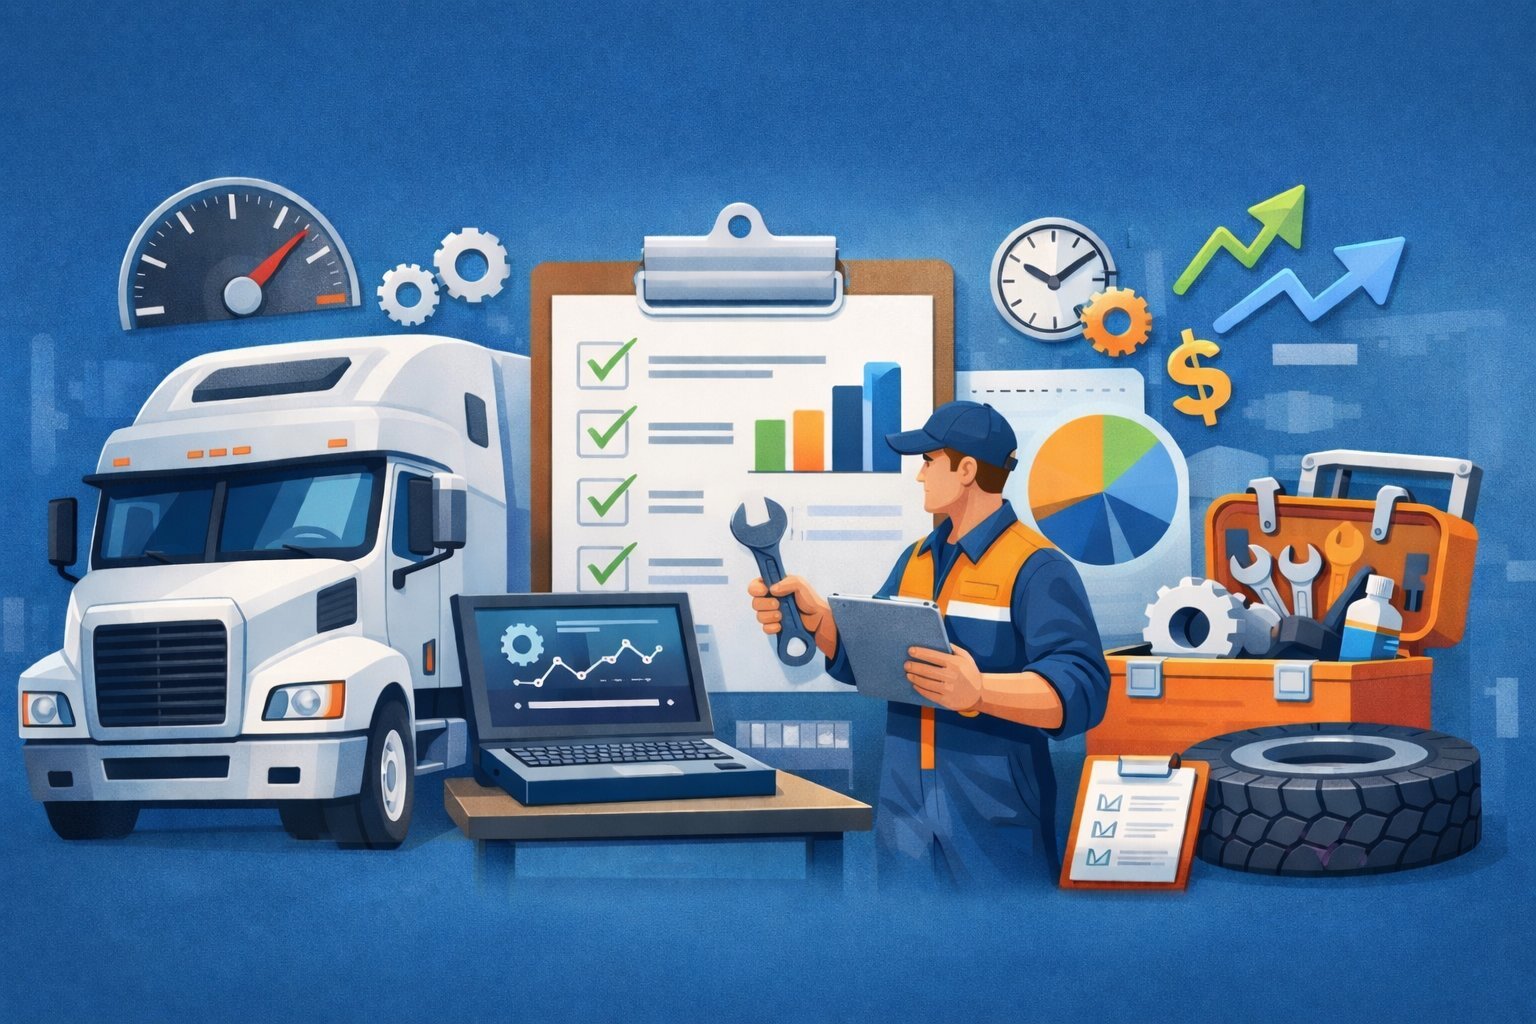
Implementation, Adoption, and Ongoing Performance Management
Deploying fleet analytics software requires more than activating dashboards; it requires structured change management and review discipline.
- Map existing data sources before migration
- Clean legacy spreadsheets and duplicate asset records
- Define dashboard views by role (shop, operations, leadership)
- Train supervisors on KPI interpretation
- Schedule recurring performance review meetings
Adoption increases when dashboards directly support operational workflows rather than exist as executive-only reporting tools.
Sustainability Outcome:
- Higher data accuracy
- Consistent performance monitoring
- Reduced reporting fatigue
Final Takeaways
Fleet reporting and analytics software transforms raw operational data into structured performance insight when supported by clear definitions and governance controls.
- Separate real-time metrics from strategic performance reporting
- Standardize KPI formulas before automating dashboards
- Assign metric ownership and refresh cadence
- Align reporting outputs with preventive maintenance planning
- Use dashboards to support decisions, not replace operational review
AUTOsist Fleet Management Resources
Fleet Maintenance KPIs (With Formulas)

Fleet Manager Guide
Preventive Maintenance Schedule Template
Fleet Reports and Dashboard